
Scaling Ibotta: A Deep Dive into Performance Metrics and Growth Strategies
Exploring the caveats and potential solutions for optimizing Ibotta's scalability, alignment, and efficiency through data-driven analysis

Introduction:
In my previous blog, we valued Ibotta pre-IPO. The company went public at $107, a 27% premium to its upper band IPO price, closing at $104 on its debut day. For this premium to be justified, the market expects a revenue growth rate of around 30% with a 20% operating margin. In this follow-up analysis, we'll deconstruct Ibotta's revenues into performance metrics to assess if the company can scale efficiently, increasing revenues faster than costs. We'll examine if their business model aligns with achieving this scalability, exploring potential caveats and strategies to optimize growth, profitability, and return on invested capital (ROIC).
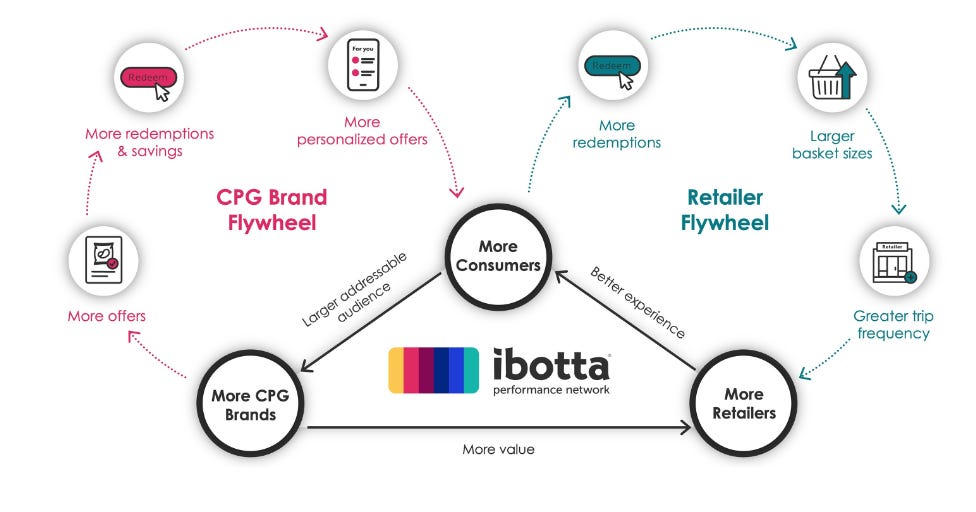
Ibotta generates revenue through performance-based marketing fees from consumer-packaged goods (CPG) brands and retailers. It leverages its mobile app to offer cash-back rewards and promotional campaigns to incentivize purchases. Ibotta earns a commission when users redeem these offers, acting as an intermediary between CPG companies and shoppers. The company has redemption revenue and ad revenue. The redemption revenue can be broken down into D2C redemptions (through the Ibotta app) and third-party publishers’ redemptions (Walmart, Dollar General, etc.).
Performance Metrics Analysis:
First things first…let us have a look on their past 8 quarters performance by metrics; where key metrics are:
Redemptions (Split between D2C and third-party)
Redeemers (Split between D2C and third-party)
Redemptions per redeemer
No. of CPG brands advertising on the platform
We must look at the revenue mix for the company between redemption revenue and ad-based revenue:
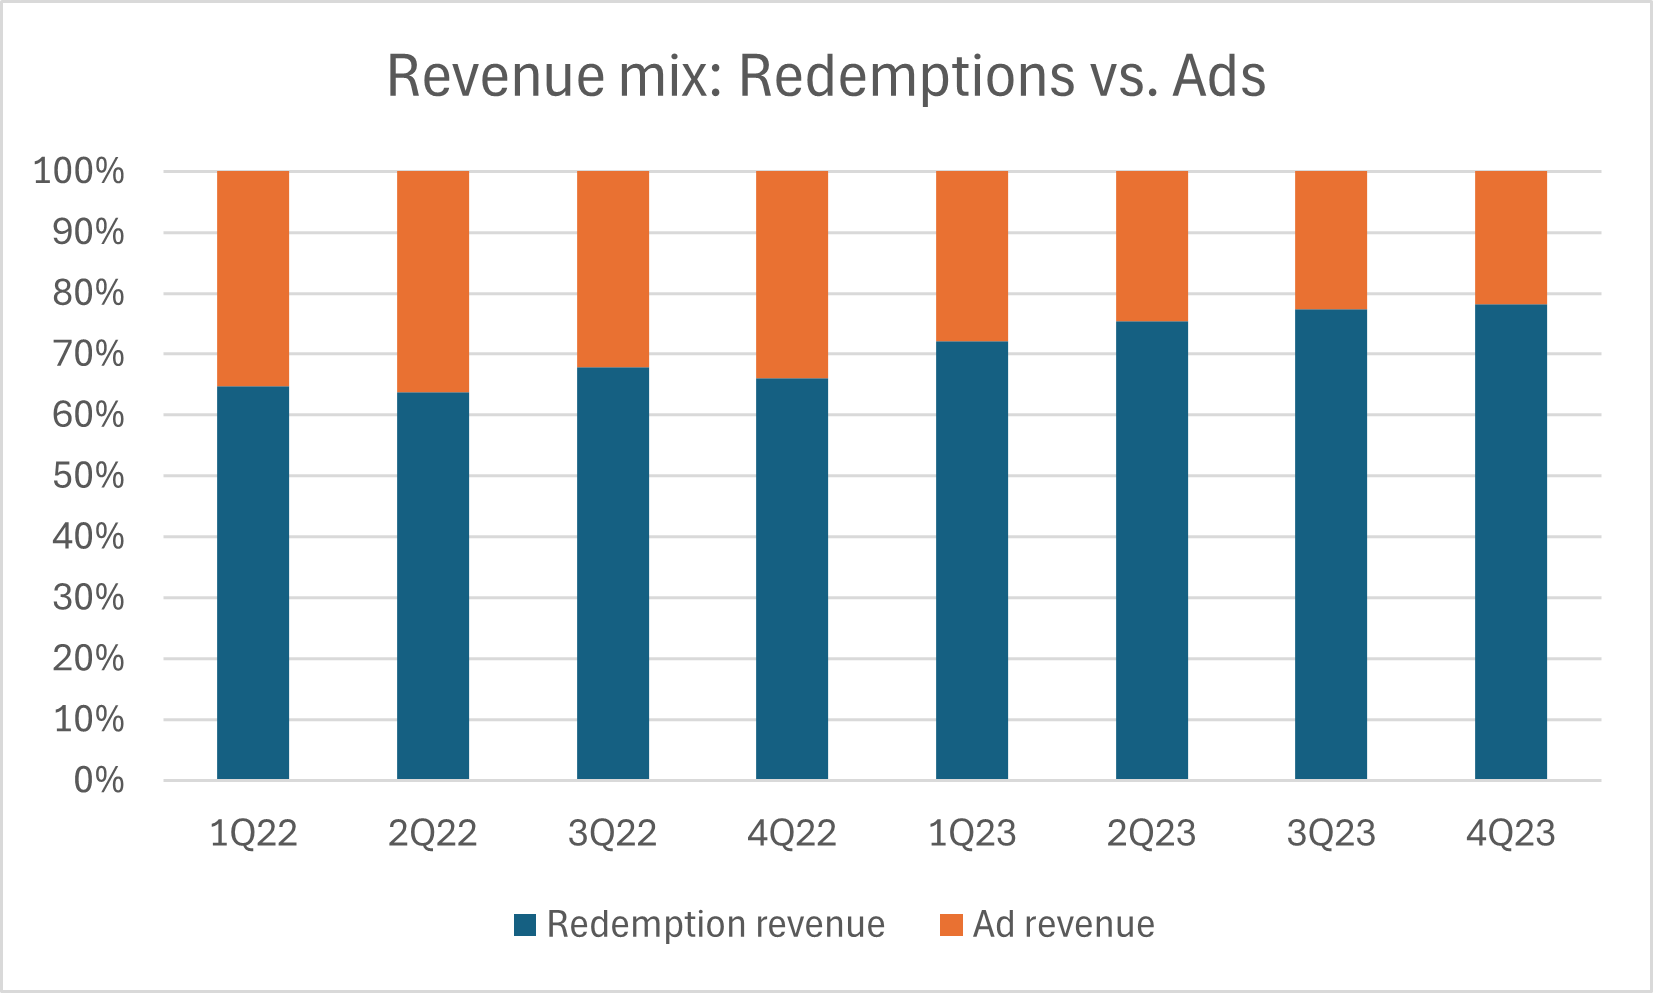
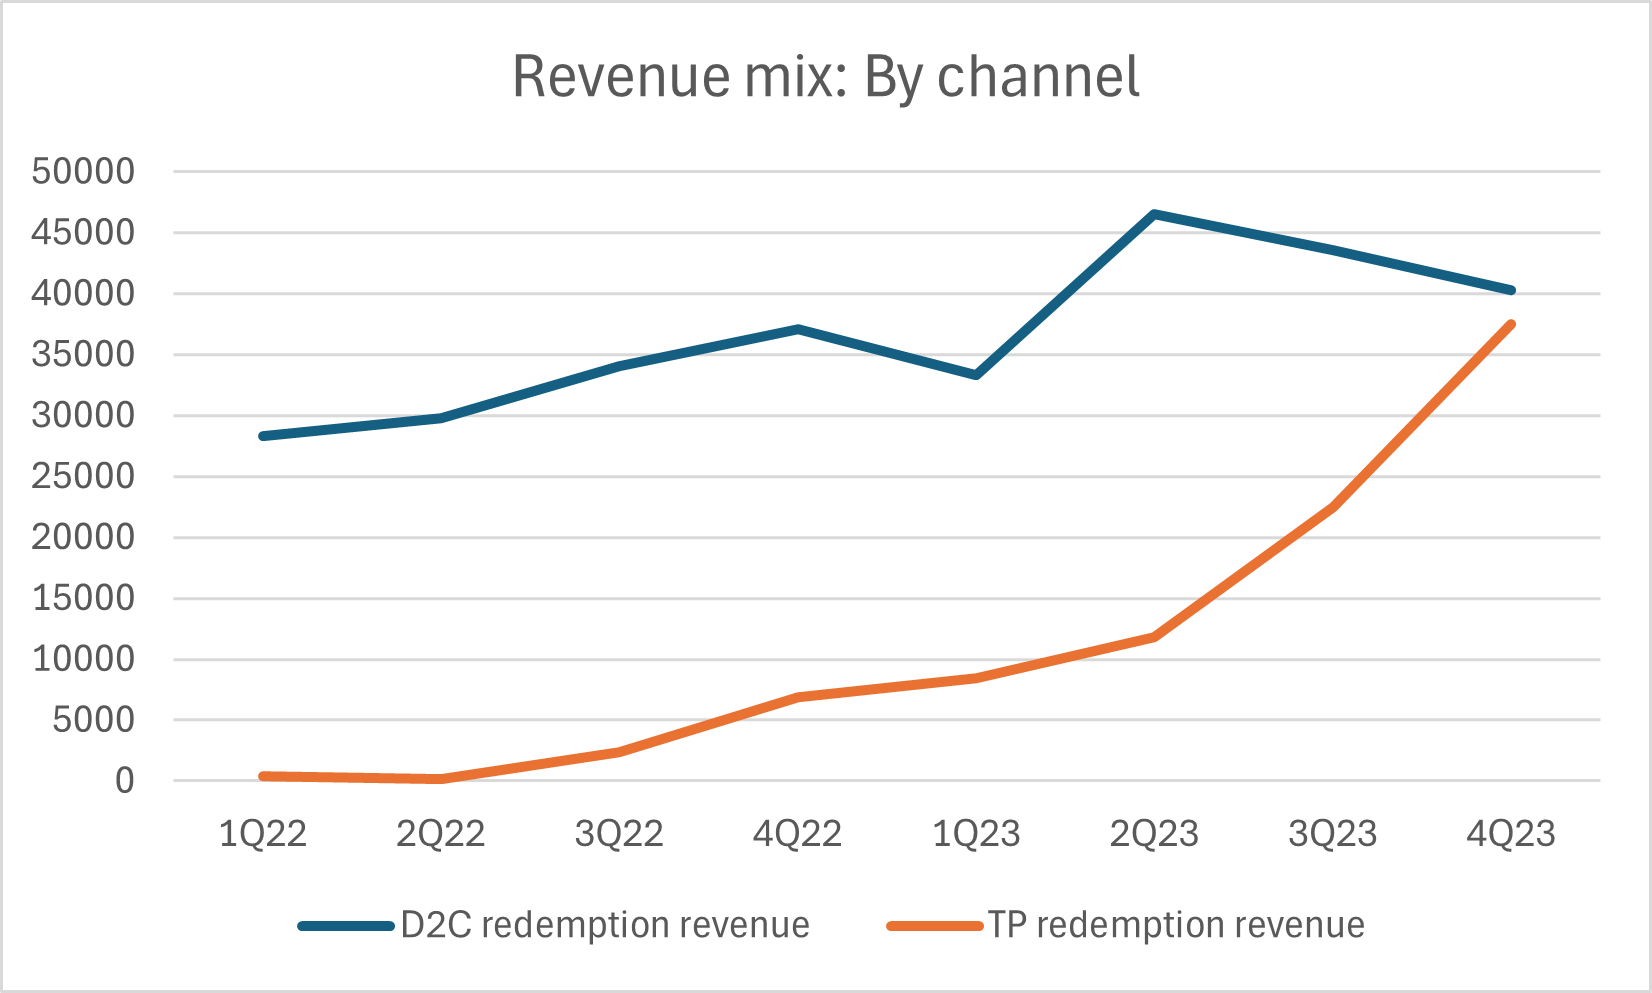
From these charts we can see that the share of ad-based revenue is decreasing QoQ, and the share of third-party publishers’ redemption revenue is increasing exponentially while D2C redemption revenue has shown an increase but has seen corrections to high growth in subsequent quarters.
Now we look at channel-wise metrics for redemptions and redeemers:
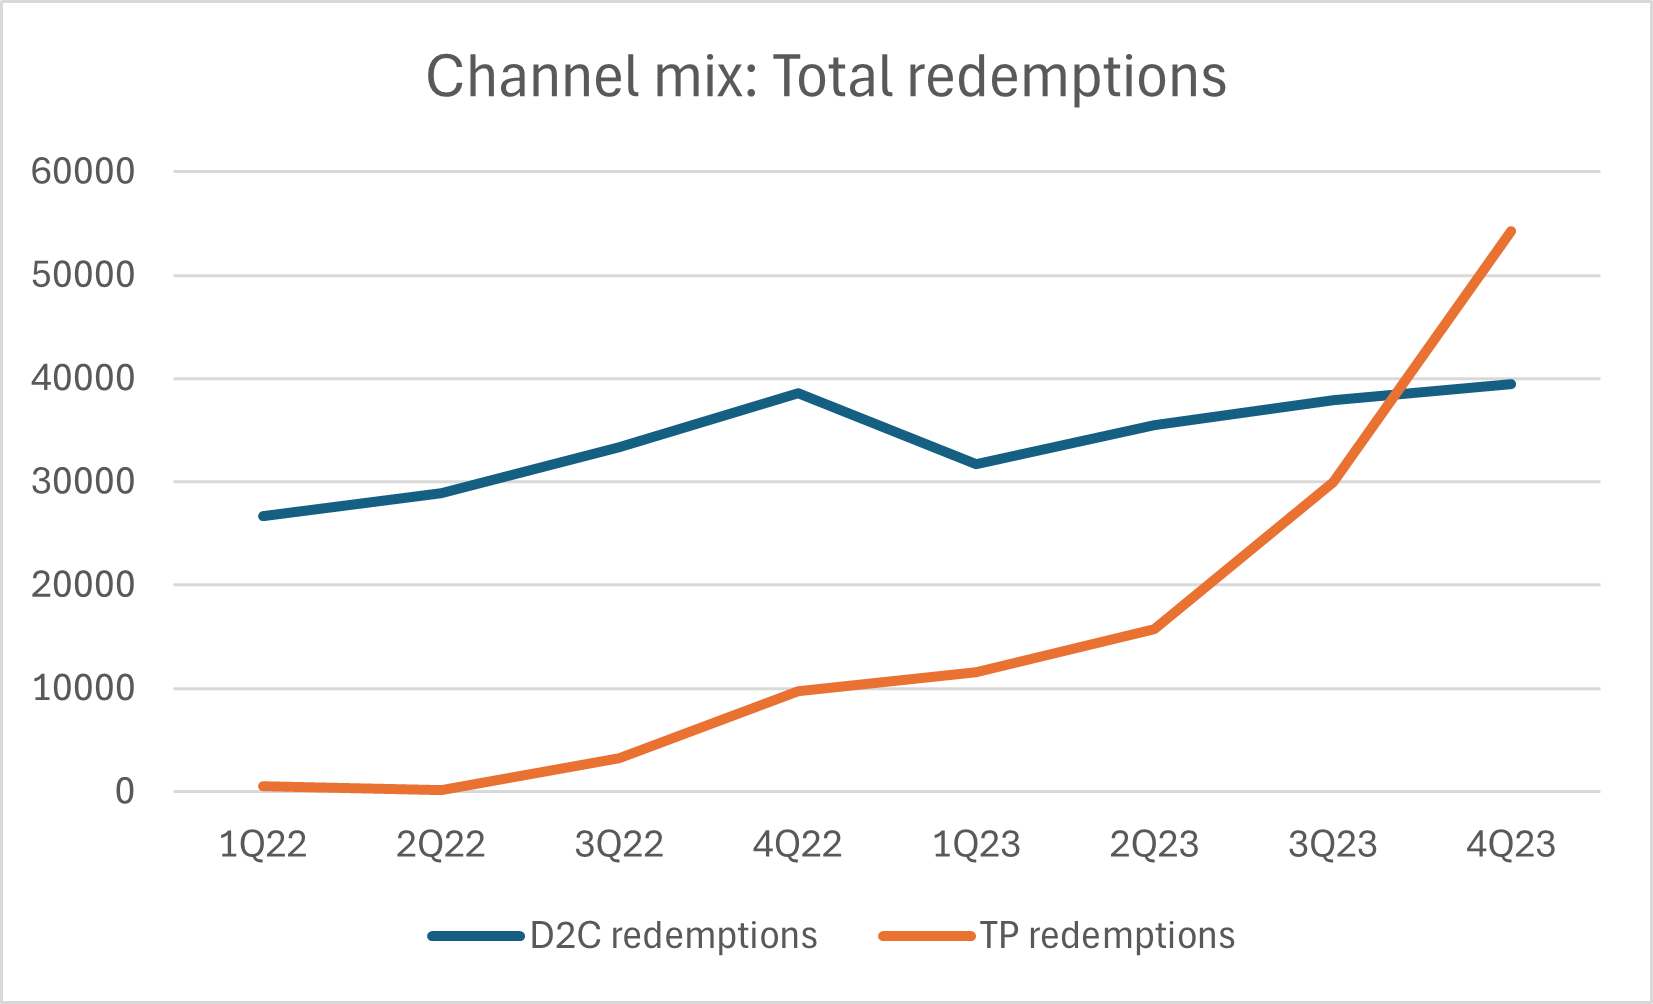
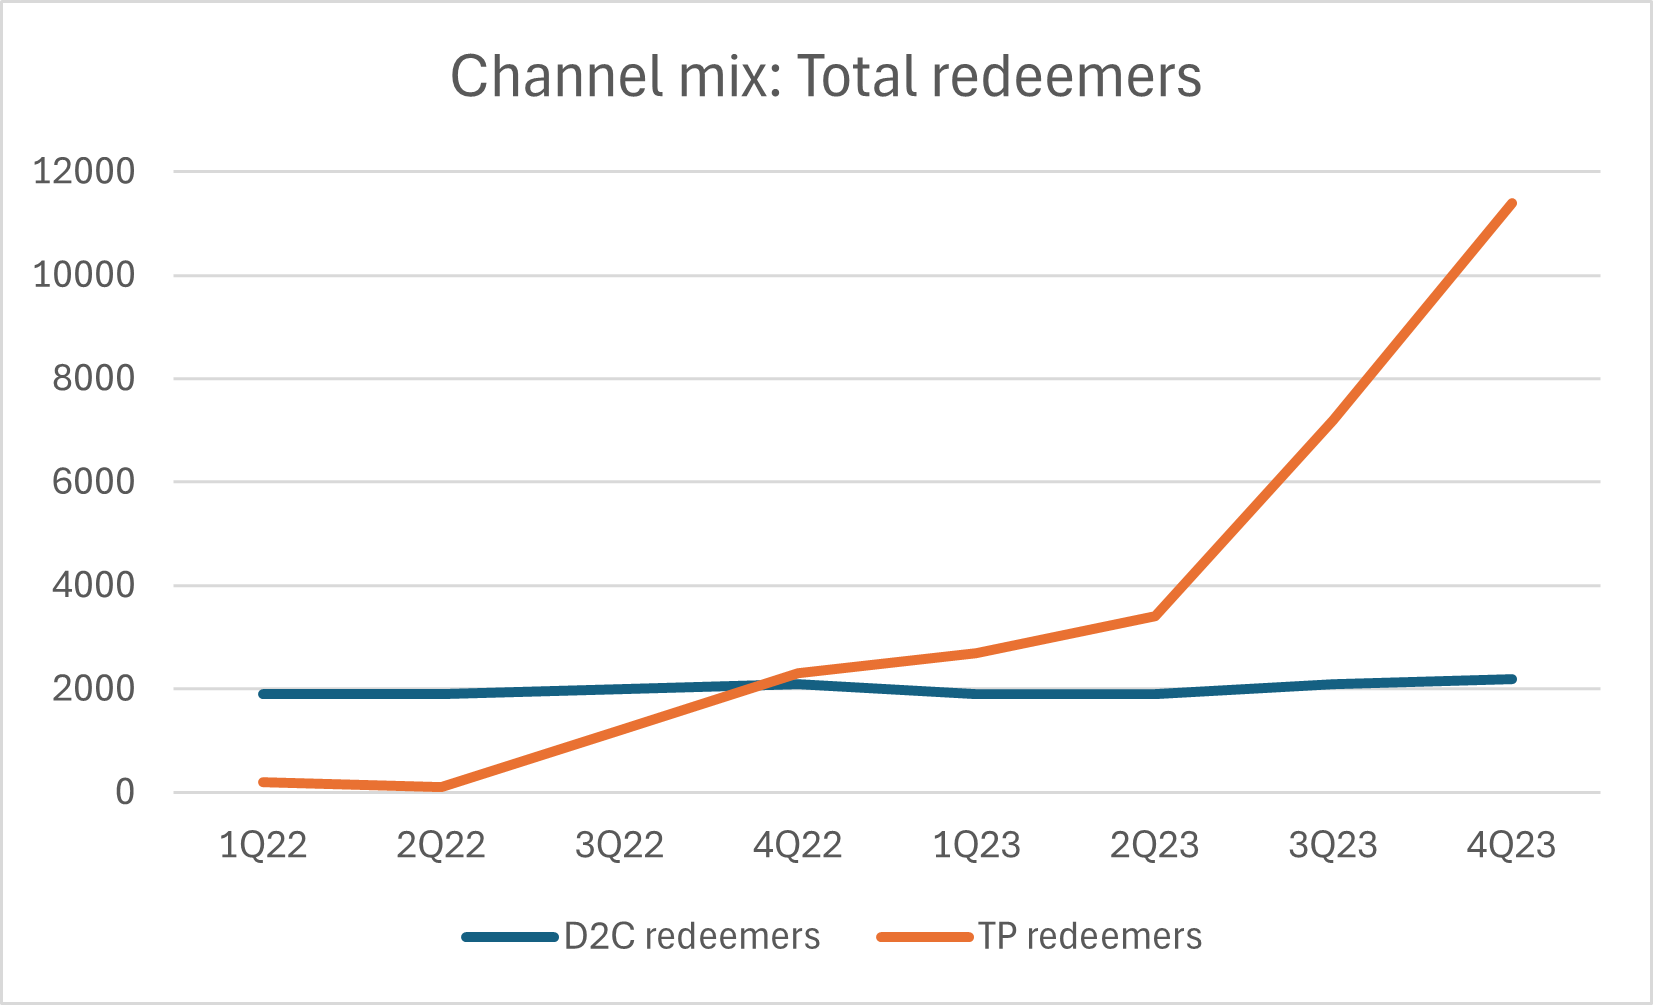
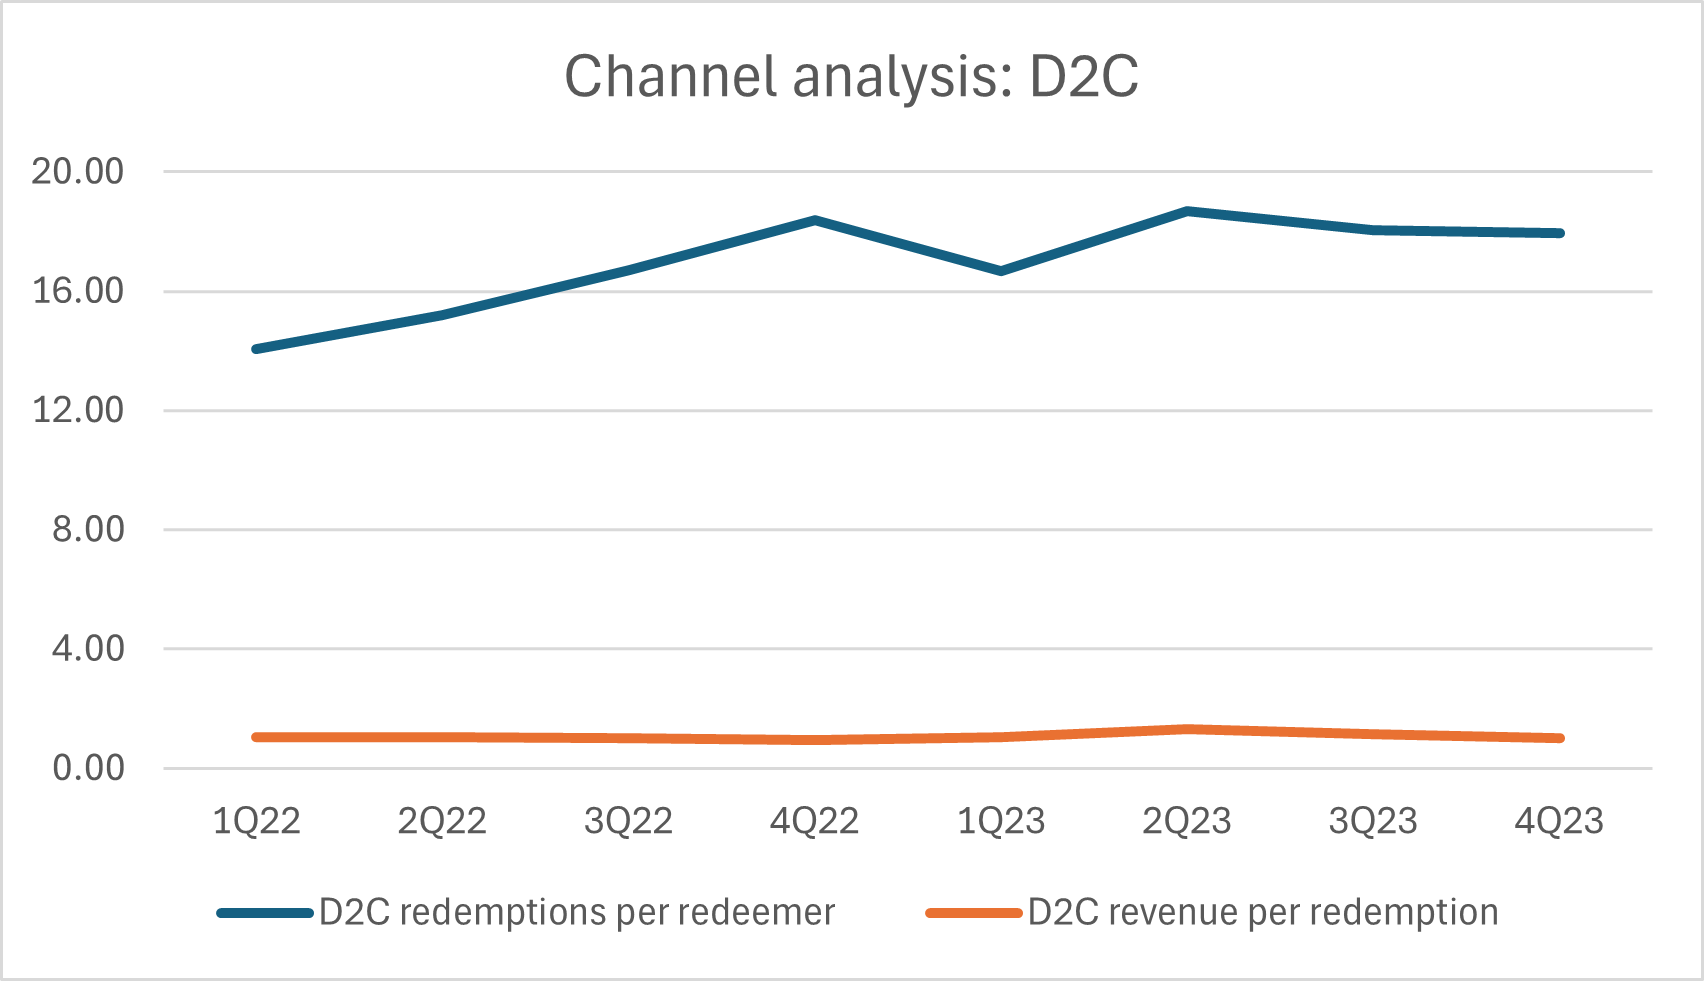
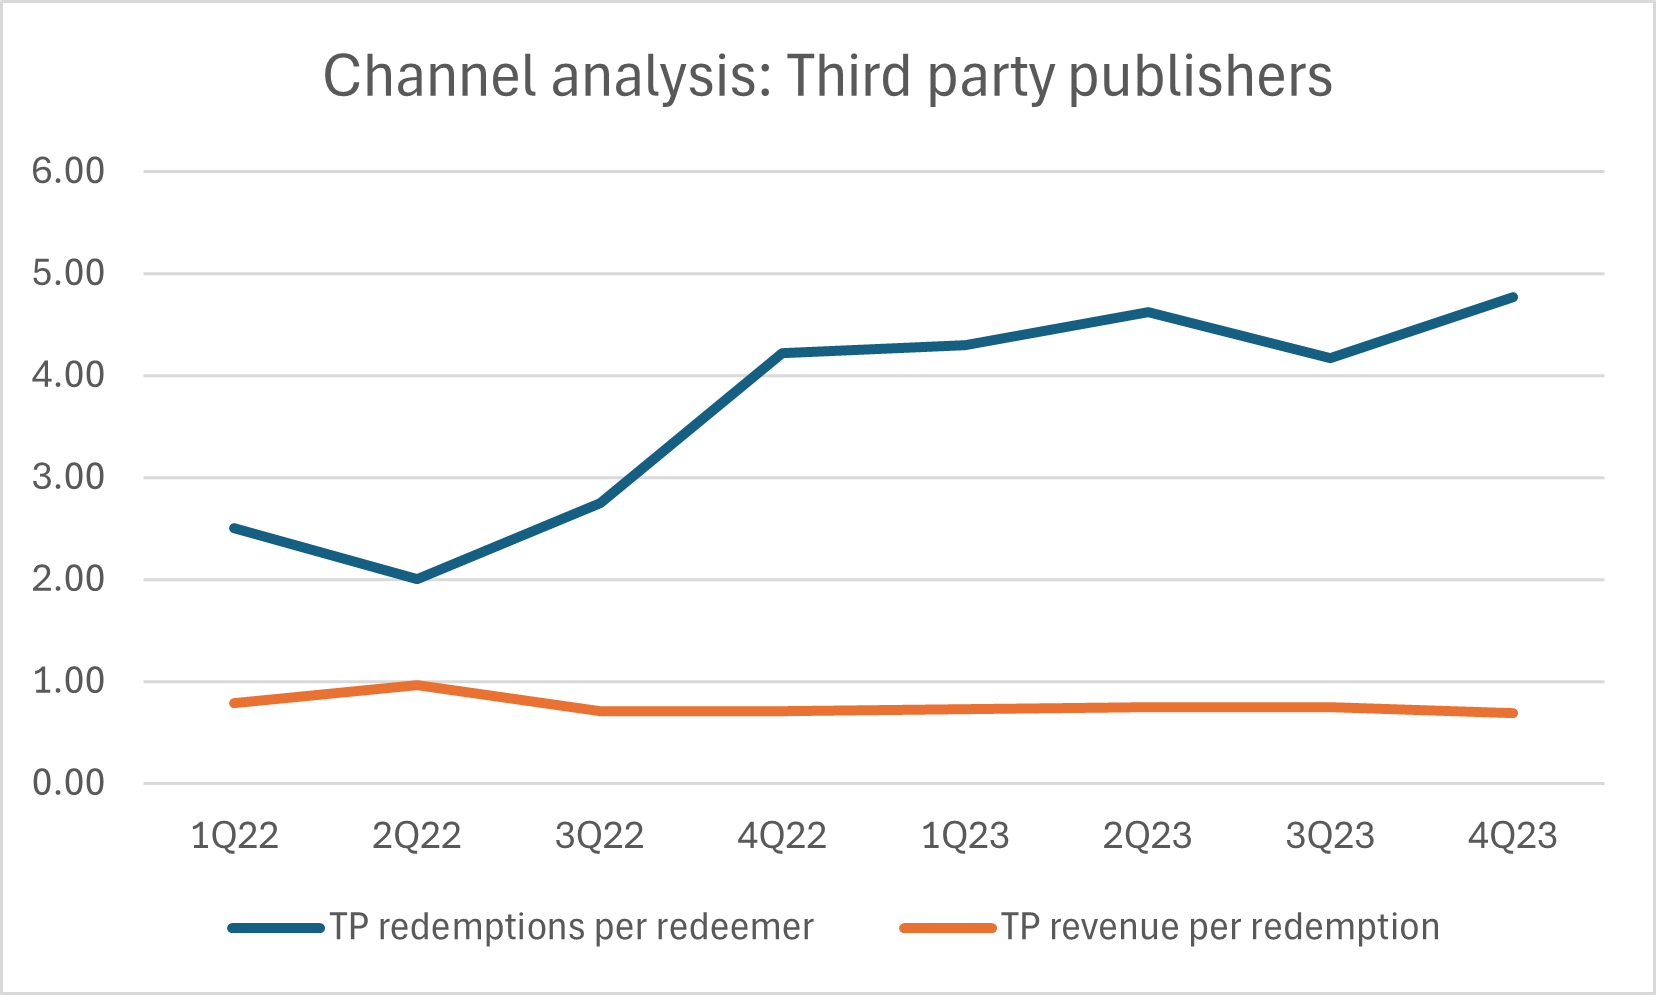
Here we can see clear trends of exponential growth in total redemptions and redeemers in third party channel as compared to D2C, but revenue per redemption being almost constant for both channels. However, redemptions per redeemer have grown by 90% over 2 years but grew only by 27% for D2C channel.
Now most importantly, we must look at redeemer and redemption level analysis:
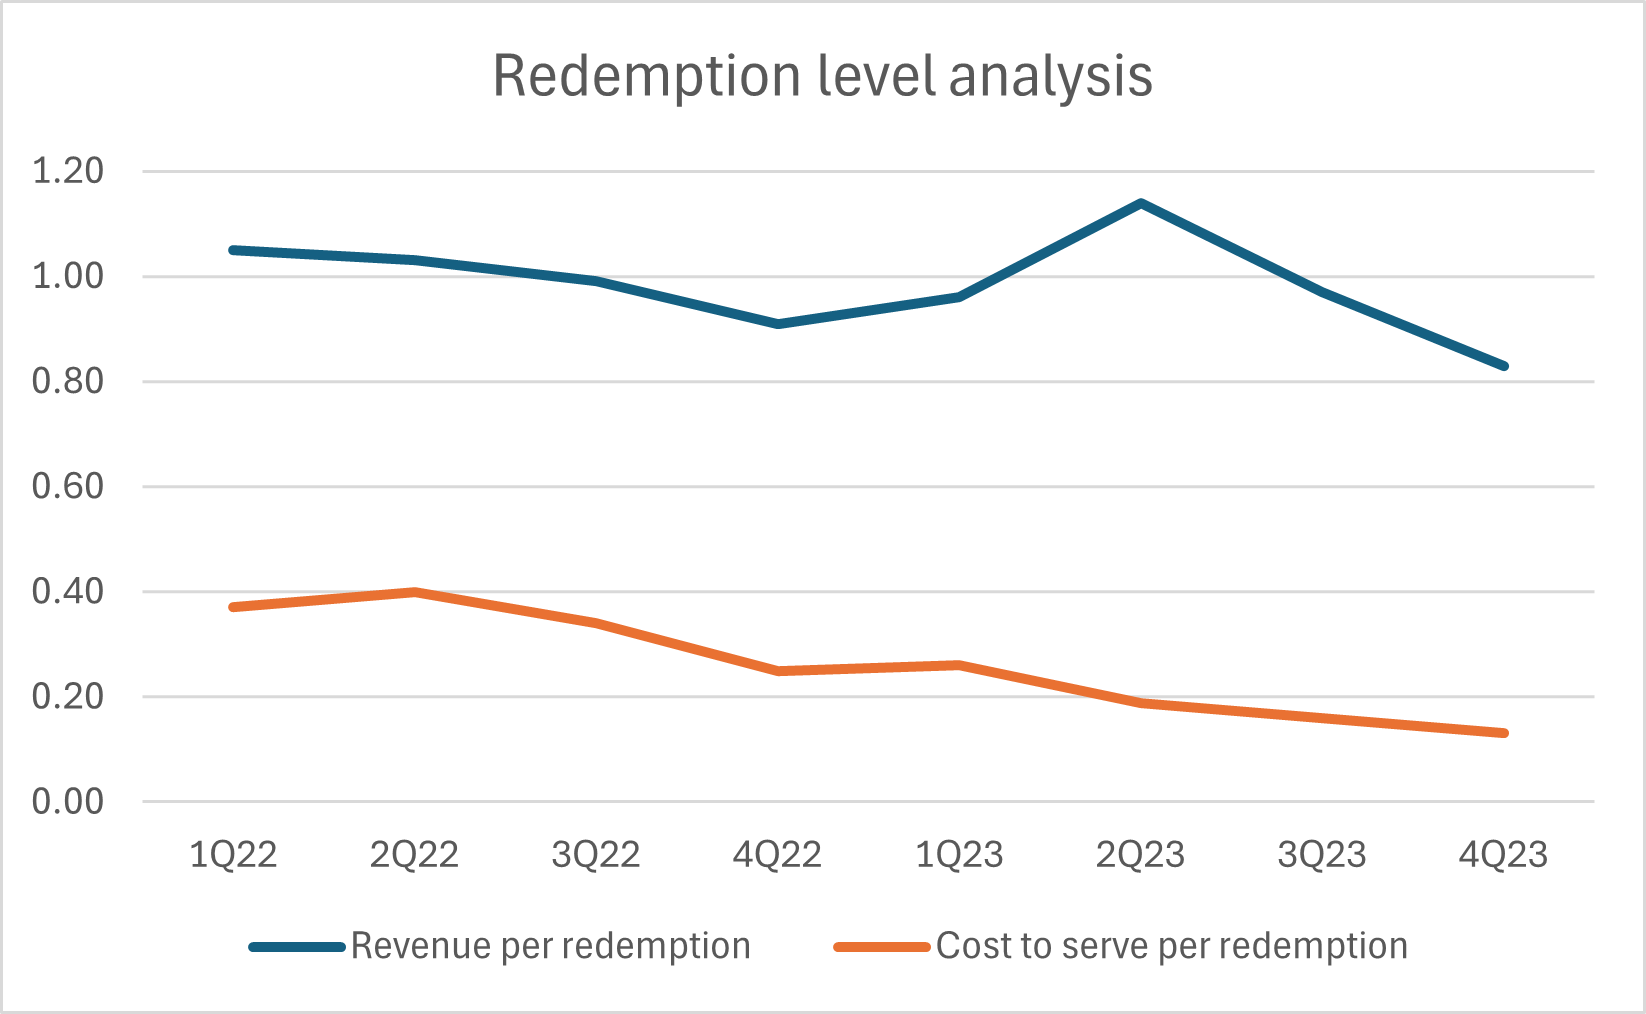
There are multiple metrics to observe here, starting with the most important one viz. CAC; it has shown an exponential decline over the past 2 years. But there are a few startling facts that are staring us in the face, that revenue per redeemer and total redemptions per redeemer have declined in similar fashion to CAC. However, cost to serve a redeemer has also declined steeply, indicating towards efficient operations.
Scalable: Are the strategy, market and business model favorable to scale?
To understand whether their business model is scalable, we must ask a key question: “Are they creating a moat based on scale, either by increasing average revenues per customer (using network effects) or reducing cost to serve per customer?”. You would be able to answer this by looking at the below chart:
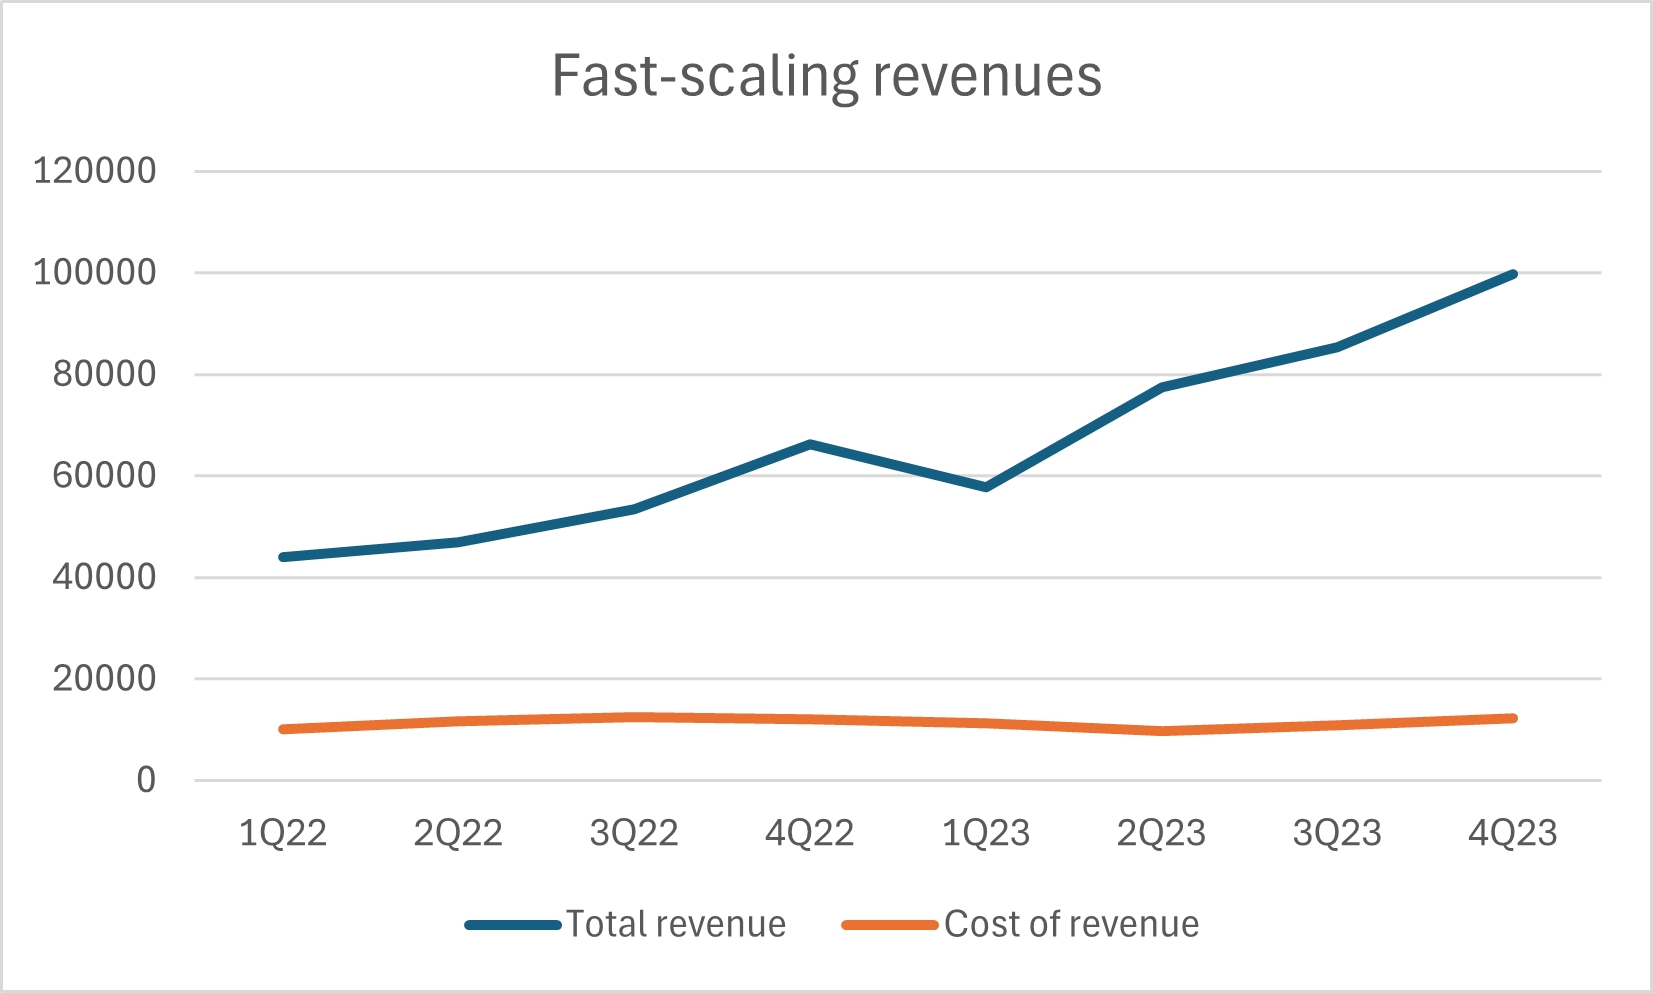
Definitely…the latter, “reducing or keeping cost to serve constant against the backdrop of growing revenue”. However, we cannot see exponential growth in revenue because of absence of network effects. That could be the case because there is no utility for a new user if an existing user is on the Ibotta platform. But one can say that the existence of so many CPG brands on the platforms do increase the number of redeemers, but each link in this 2-sided network effect is not generating value for other users, therefore, we can say it exhibits weak network effects. The company has reduced cost to serve dramatically over 2 years, showing good learning curve in operations. But there exist low switching costs for users, in case there are other platforms offering coupons, users will easily shift to them. Ibotta can increase switching costs for users by entering into exclusive redemption arrangements with brands by offering favorable terms and creating a win-win situation for both.
Aligned: Is there product and process market fit?
In order to be scalable, there must be alignment in business model components like revenue model, resources, delivery model and customer preferences.
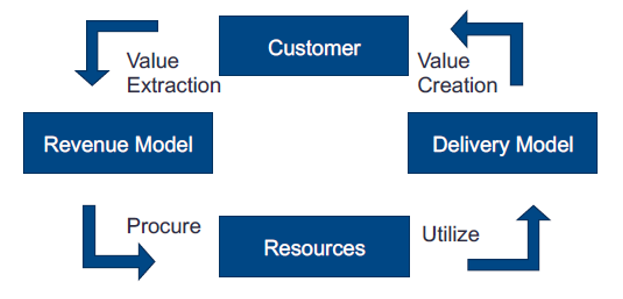
Extrapolating this framework over Ibotta’s business model, we get:
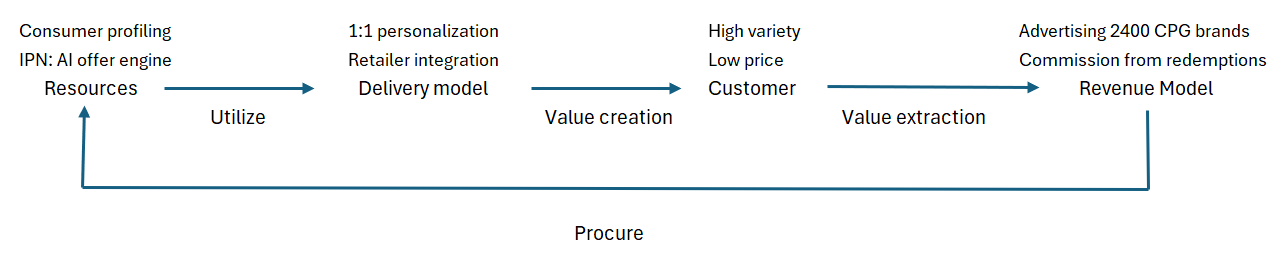
Here we can see how Ibotta is using different resources to deliver value to customers and capturing value for itself through CPG brands, maximizing convenience for users.
Efficient: Can it make money efficiently?
Here we must be able to answer: Does Ibotta know how to “make money” in a repeatable and “predictable” way?
To answer the above question, we need to measure and narrow down metrics, and by virtue of changing which metrics can ROIC be maximized. To narrow down key metrics, we draw a ROIC tree to gain an understanding of the sensitivity of the same to different input metrics:
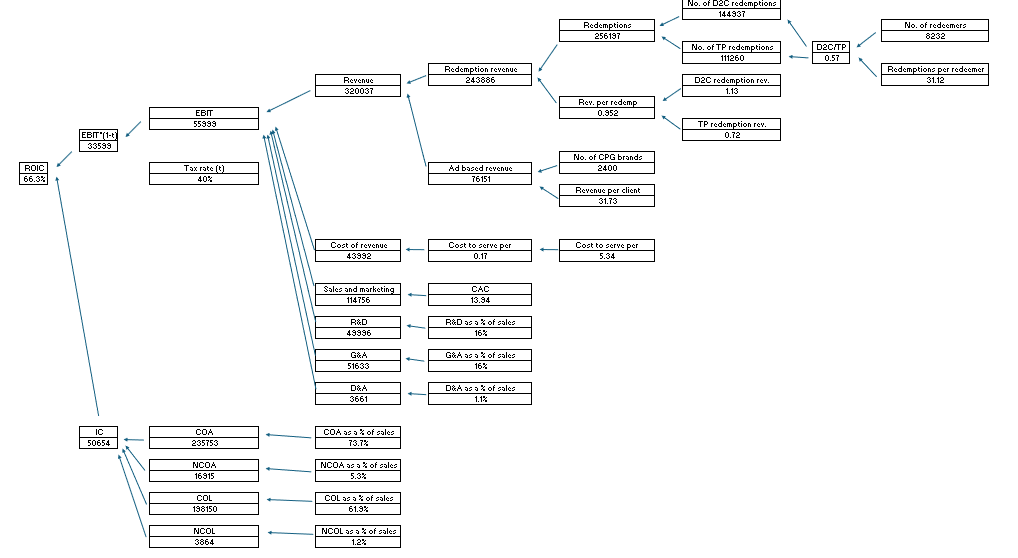
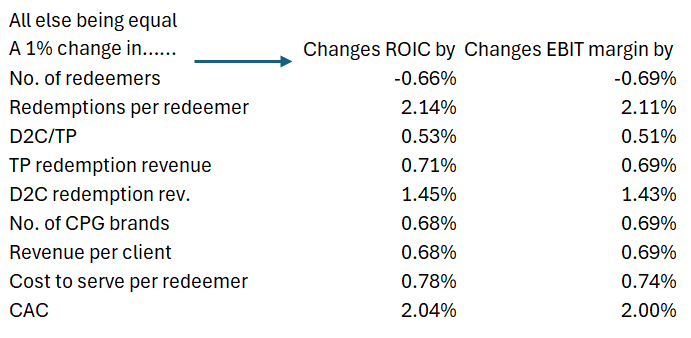
The ROIC tree takes into account NOPAT adjusted for IC (NOA), based on 2023 annual report. We can see from the sensitivity analysis that ROIC is most sensitive to an increase in redemptions per redeemer, CAC and D2C redemption revenue. A corresponding strategy towards the same will be incentivizing users with better offers, reducing sales and marketing expenses and increasing take rates from CPG brands. To implement these strategies, Ibotta must focus on inbound marketing and creating high switching costs for CPG brands. With improvement in macro factors like reducing inflation in future and increase in consumption, there should be an increase in redemptions per redeemer, naturally.
This is an outside analysis, and we will never be able to fully figure out the strategy they must execute, but we can see by focusing on a few metrics we can maximize value for all stakeholders.